UK Solar Panel Output by Month: Real PVGIS Data
What an 800W plug-in solar setup generates each month in London, Birmingham and Glasgow, from PVGIS data - and how deep the December trough goes.
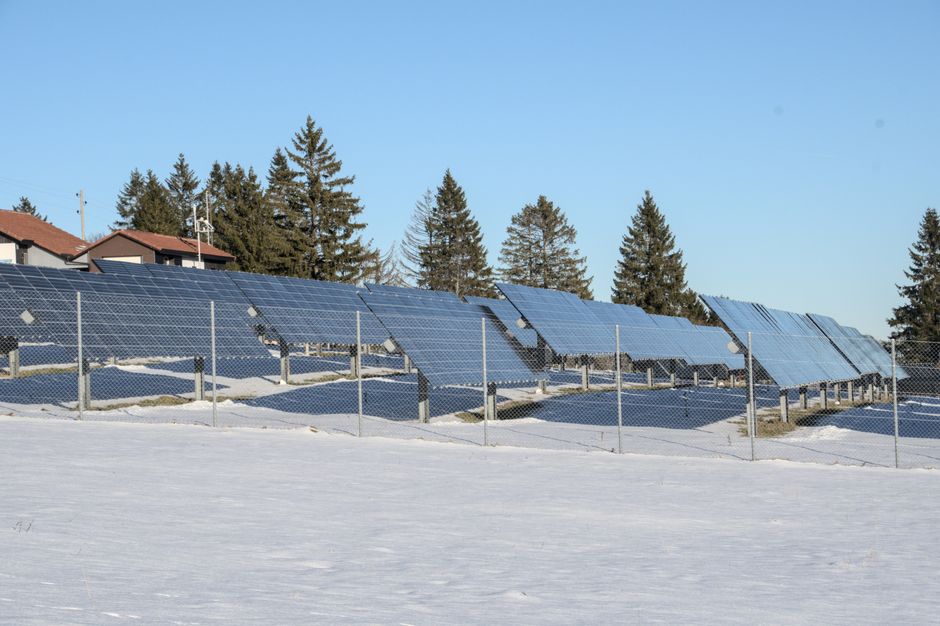
UK solar panel output by month follows a steeply lopsided curve: an 800W plug-in setup that produces over 3 kWh a day in high summer drops to roughly 1 kWh a day in London in December, and closer to half a kWh in Glasgow. This page puts real modelled numbers on that curve, month by month, for three representative UK locations.
Every figure below comes from PVGIS (the European Commission Joint Research Centre's free photovoltaic modelling tool), queried in September 2026 through its public PVcalc interface. These are modelled estimates built from satellite climate data, not first-hand measurements - published-data analysis with every assumption stated, so you can rerun the same query for your own postcode and check the numbers yourself. If you are new to the topic, start with our complete plug-in solar guide; this piece answers the narrower question every buyer eventually asks: how little do you get in winter?
Where do these numbers come from?
The dataset is PVGIS version 5.2, the photovoltaic geographical information system published by the European Commission's Joint Research Centre. Its PVcalc tool estimates monthly output for any location from the PVGIS-SARAH2 solar radiation database, which is built from long-term satellite observations. The exact query used for each city:
- System size: 0.8 kWp of crystalline silicon panel - chosen because it approximates the 800W per-home cap on UK plug-in solar. Output scales linearly, so a 0.4 kWp panel produces half these figures and a 1.6 kWp array double.
- System loss: 14%, the PVGIS default allowance for cabling, inverter and soiling losses.
- Mounting: fixed, at the tilt PVGIS optimises for the UK (40 degrees from horizontal), facing due south (azimuth 0). This is the model's optimum - a real balcony or fence mounting will usually do worse, and the vertical-mounting section below quantifies how much.
- Locations: London (modelled at 51.51, -0.13), Birmingham (modelled at 52.48, -1.90) and Glasgow (modelled at 55.86, -4.26) - southern England, the Midlands and central Scotland.
One more framing note: PVGIS models a typical year averaged from many years of climate data. Any individual year can come in above or below these figures, and a dull December can halve that month's already small total.
How much does an 800W setup generate each month?
Monthly output in kWh for a 0.8 kWp system at optimal fixed tilt, from PVGIS-SARAH2 (figures rounded to one decimal; annual totals as returned by PVGIS):
| Month | London (kWh) | Birmingham (kWh) | Glasgow (kWh) |
|---|---|---|---|
| January | 34.0 | 30.9 | 18.8 |
| February | 43.6 | 42.6 | 35.1 |
| March | 71.5 | 69.2 | 56.9 |
| April | 91.8 | 85.6 | 82.1 |
| May | 95.7 | 92.6 | 93.3 |
| June | 95.8 | 90.8 | 85.8 |
| July | 97.7 | 93.3 | 86.2 |
| August | 87.1 | 83.6 | 75.9 |
| September | 77.7 | 73.1 | 60.2 |
| October | 55.5 | 50.5 | 43.4 |
| November | 40.2 | 35.8 | 27.8 |
| December | 31.7 | 29.0 | 16.6 |
| Year | 822 | 777 | 682 |
Three patterns stand out. First, the summer plateau is broad: in London, every month from April to August clears 87 kWh, and July peaks at 97.7 kWh. Second, the collapse into winter is fast - London loses almost half its monthly output between September (77.7 kWh) and October (55.5 kWh), and nearly half again by December. Third, latitude matters most in winter: Glasgow's annual total is about 17% below London's, but its December figure (16.6 kWh) is nearly half of London's 31.7 kWh. Northern winters are shorter on daylight and cloudier, and both effects stack.
Birmingham tracks London closely all year, sitting roughly 3 to 9% lower each month. For most of England, the London and Birmingham columns bracket what an optimally mounted system would see.
How deep is the winter trough?
Deep enough that it should anchor every purchase decision. Compare December with each city's best month:
- London: 31.7 kWh in December against 97.7 kWh in July - December delivers about a third of the peak, or roughly 1.0 kWh a day against 3.2 kWh a day.
- Birmingham: 29.0 kWh in December against 93.3 kWh in July - again about a third, or 0.9 kWh a day.
- Glasgow: 16.6 kWh in December against 93.3 kWh in May - less than a fifth of the peak, or about 0.5 kWh a day.
Stretch the window and the imbalance persists. November to January combined contributes 105.9 kWh in London - 12.9% of the year's output in a quarter of the year. In Glasgow the same three months contribute 63.2 kWh, just 9.3% of the annual total. Even taking the whole winter half-year, October to March produces about a third of annual output in London and Birmingham and 29% in Glasgow; the summer half-year produces the other two thirds.
The practical reading: an 800W system in midwinter is a trickle-charger for your home's background load - a router, a fridge, standby devices - not a meaningful dent in heating-season bills. The kWh that make plug-in solar worthwhile are earned between March and September. Our savings guide shows how to turn these monthly figures into money, and why self-consumption decides most of it.
What changes with vertical balcony mounting?
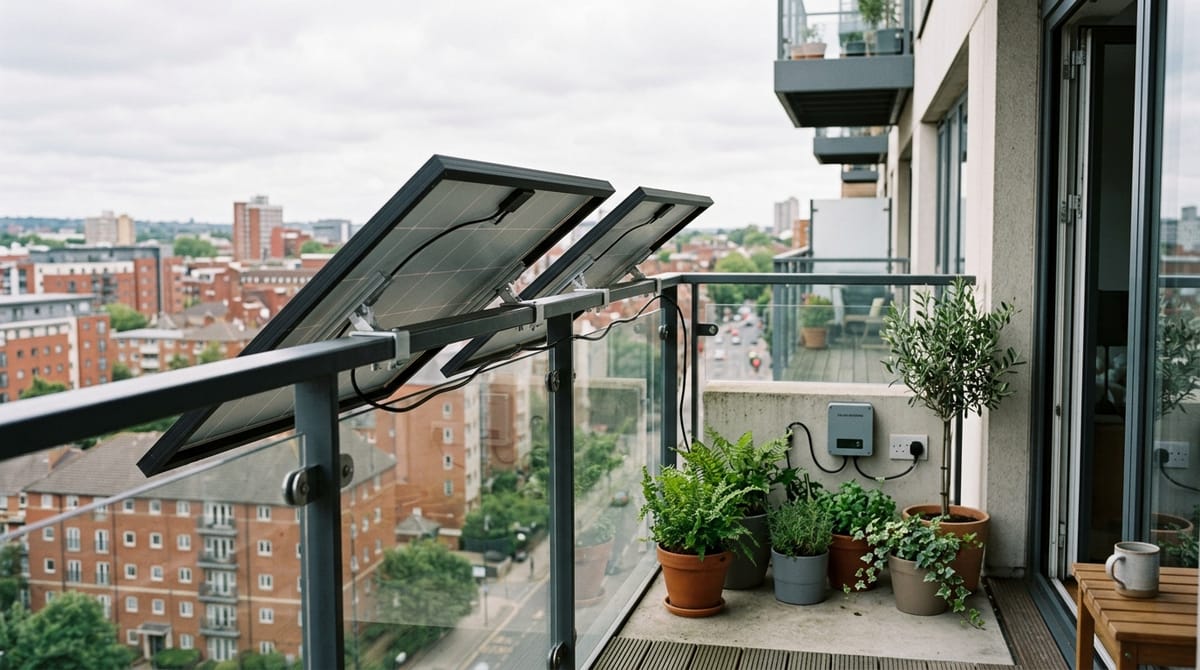
Everything above assumes the model's optimum: panels tilted at 40 degrees, facing due south. Many plug-in systems hang flat against a balcony rail or fence - effectively vertical at 90 degrees. Running the same London query with a vertical, south-facing panel changes the shape of the whole year:
| Mounting | December (kWh) | June (kWh) | Best month (kWh) | Annual (kWh) |
|---|---|---|---|---|
| Tilted 40°, south-facing | 31.7 | 95.8 | 97.7 (July) | 822 |
| Vertical 90°, south-facing | 35.7 | 50.5 | 61.8 (April) | 597 |
Two things happen at once. Across the year the vertical system produces 597 kWh against 822 kWh - about 27% less. But in December the vertical panel actually wins, 35.7 kWh against 31.7 kWh, because the winter sun sits so low that a vertical surface faces it more squarely, and snow does not settle on it. The cost is summer: June output nearly halves, from 95.8 kWh to 50.5 kWh, because the high summer sun strikes a vertical panel at a shallow angle.
The result is a much flatter curve - the vertical system's best month (April, 61.8 kWh) is only 1.7 times its worst, against 3.1 times for the tilted one. If your mounting is somewhere between the two, say a panel leaned at 60 degrees against a wall, your months will land between these columns. East- or west-facing mountings lose more again; PVGIS lets you model any azimuth for your own address.
What do the monthly numbers mean for buyers?
Plug-in solar has been legal in the UK since 27 August 2026, when SI 2026/848 came into force - the regulations that created the 800W per-home cap these figures are modelled on, alongside a certified-kit-only rule and a requirement to notify your network operator under G98 within 28 days of plugging in. The rule-change explainer covers what changed and the jargon guide decodes G98 and friends.
Against that backdrop, the monthly curve carries three buying lessons:
- Judge payback on the year, not on June. A seller quoting summer daily output is describing three or four months of the year. Annual figures - roughly 680 to 820 kWh for an optimally mounted 800W system, less for balcony rails - are the honest basis.
- Winter output will not run your heating. At 0.5 to 1 kWh a day in December, the system offsets background load only. If winter evenings are when you use electricity, a battery that time-shifts summer-pattern generation matters far more than an extra panel.
- Location moves the winter floor more than the annual total. Between London and Glasgow the annual gap is 17%, but the December gap is nearly 50%. The further north you are, the more the case rests on March to September.
Which assumptions should you sanity-check?
Model, not meter
These are PVGIS estimates from satellite-derived climate averages, not readings from an installed system. Treat them as a well-grounded central case.
Optimal tilt assumed
The headline table models a 40-degree south-facing mount. Balcony rails, fences and shallow leans all yield less - vertical mounting about 27% less over a year in the London run above.
No shading included
PVGIS assumes an unshaded horizon. A neighbouring building, tree or parapet that shades the panel - especially against a low winter sun - cuts real output below every figure here.
14% system loss is generic
The PVGIS default covers typical cable, inverter and soiling losses. A hot inverter, long extension run or grimy panel pushes losses higher.
Typical-year averages
SARAH2 models a climatological year. A sunny spring or a grey December in any single year can move a month's figure well away from the table.
Panel rating vs the 800W cap
The model uses 0.8 kWp of panel. Real certified kits pair panel and a capped inverter in various ratios, which shifts the curve slightly - the certified-kits guide covers what is actually on sale.
Frequently asked questions
How much does an 800W plug-in solar setup generate in December in the UK?
Why is UK solar output so much lower in winter?
Do these figures change for bigger or smaller systems?
How accurate is PVGIS for UK estimates?
How do I run these numbers for my own address?

Plug-in Solar in the UK: The Complete 2026 Guide

Plug-in Solar Savings: How Much Can You Save?

Can You Add a Battery to Plug-In Solar?
UK Plug-in Solar 2026: What Changed on 27 August?
Turn kWh into pounds
Monthly output is only half the sum - what you save depends on how much of it you actually use. The savings guide walks through the maths step by step.